Creating Your First Diagram
To understand the fundamental concepts, we create a Kafka Streams Topology Diagram for the prominent ‘WordCount Demo’ that used to be featured on Confluent’s Kafka Streams Quick Start guide.
Following this tutorial hands-on takes 10-15min and will allow you to grasp all the basics needed to start crafting diagrams for your own stream processing topologies. The only prerequisite is to have the KSTD library installed.
Tutorial: ‘WordCount Demo’
Topology Recap
Here’s the Java code for the topology, which should be self-explanatory:
// Serializers/deserializers (serde) for String and Long typesfinal Serde<String> stringSerde = Serdes.String();final Serde<Long> longSerde = Serdes.Long();
// Construct a `KStream` from the input topic "streams-plaintext-input", where message values// represent lines of text (for the sake of this example, we ignore whatever may be stored// in the message keys).KStream<String, String> textLines = builder.stream("streams-plaintext-input", Consumed.with(stringSerde, stringSerde));
KTable<String, Long> wordCounts = textLines    // Split each text line, by whitespace, into words.  The text lines are the message    // values, i.e. we can ignore whatever data is in the message keys and thus invoke    // `flatMapValues` instead of the more generic `flatMap`.    .flatMapValues(value -> Arrays.asList(value.toLowerCase().split("\\W+")))    // We use `groupBy` to ensure the words are available as message keys    .groupBy((key, value) -> value)    // Count the occurrences of each word (message key).    .count();
// Convert the `KTable<String, Long>` into a `KStream<String, Long>` and write to the output topic.wordCounts.toStream().to("streams-wordcount-output", Produced.with(stringSerde, longSerde));
(Full source: WordCountLambdaExample.java )
Step-by-Step Walkthrough
Step 1: Topology Container, Source Topic, KStream
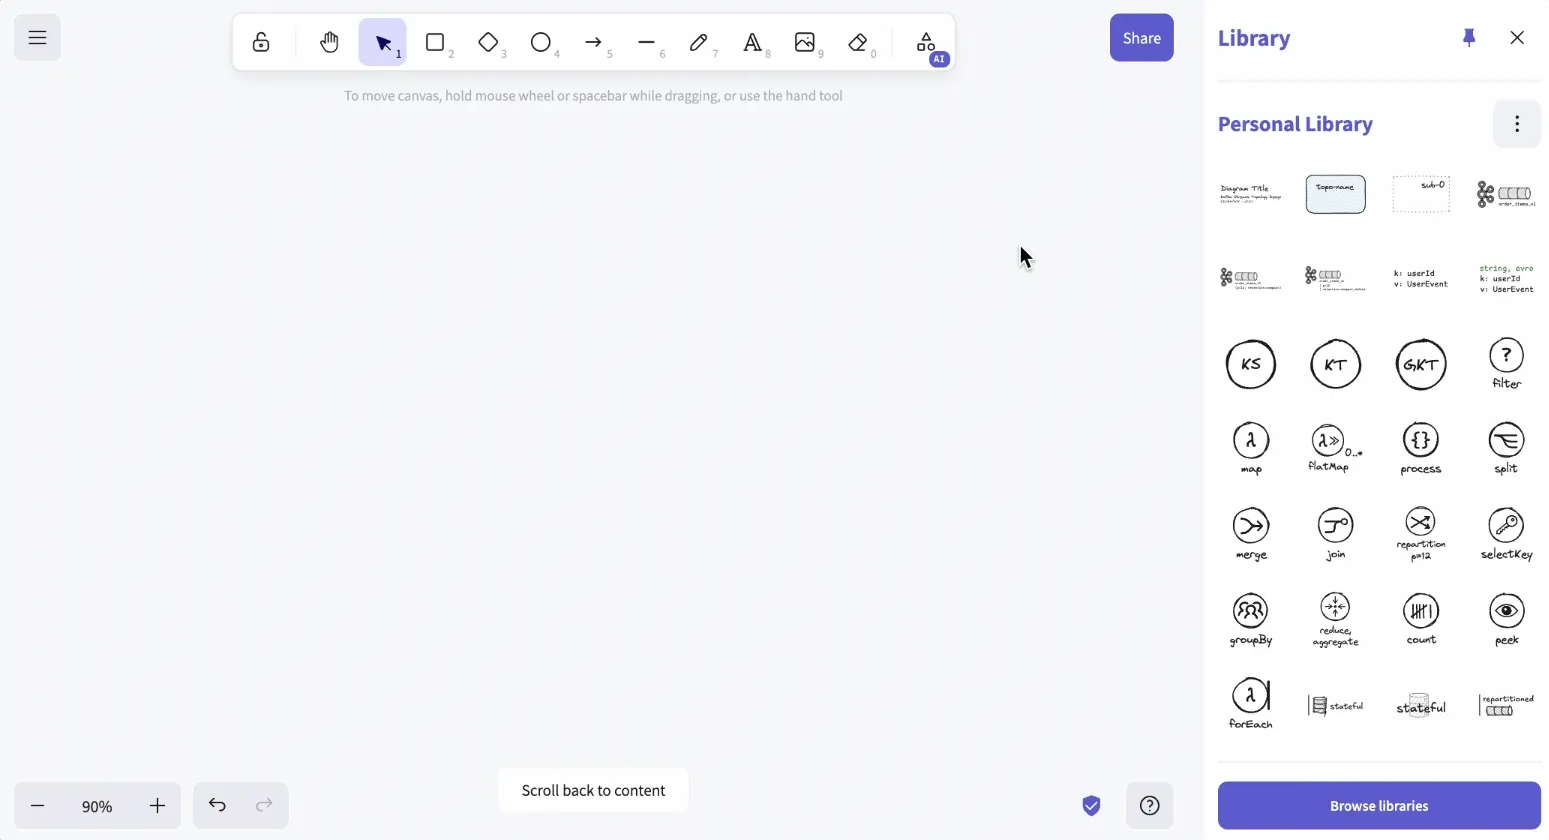
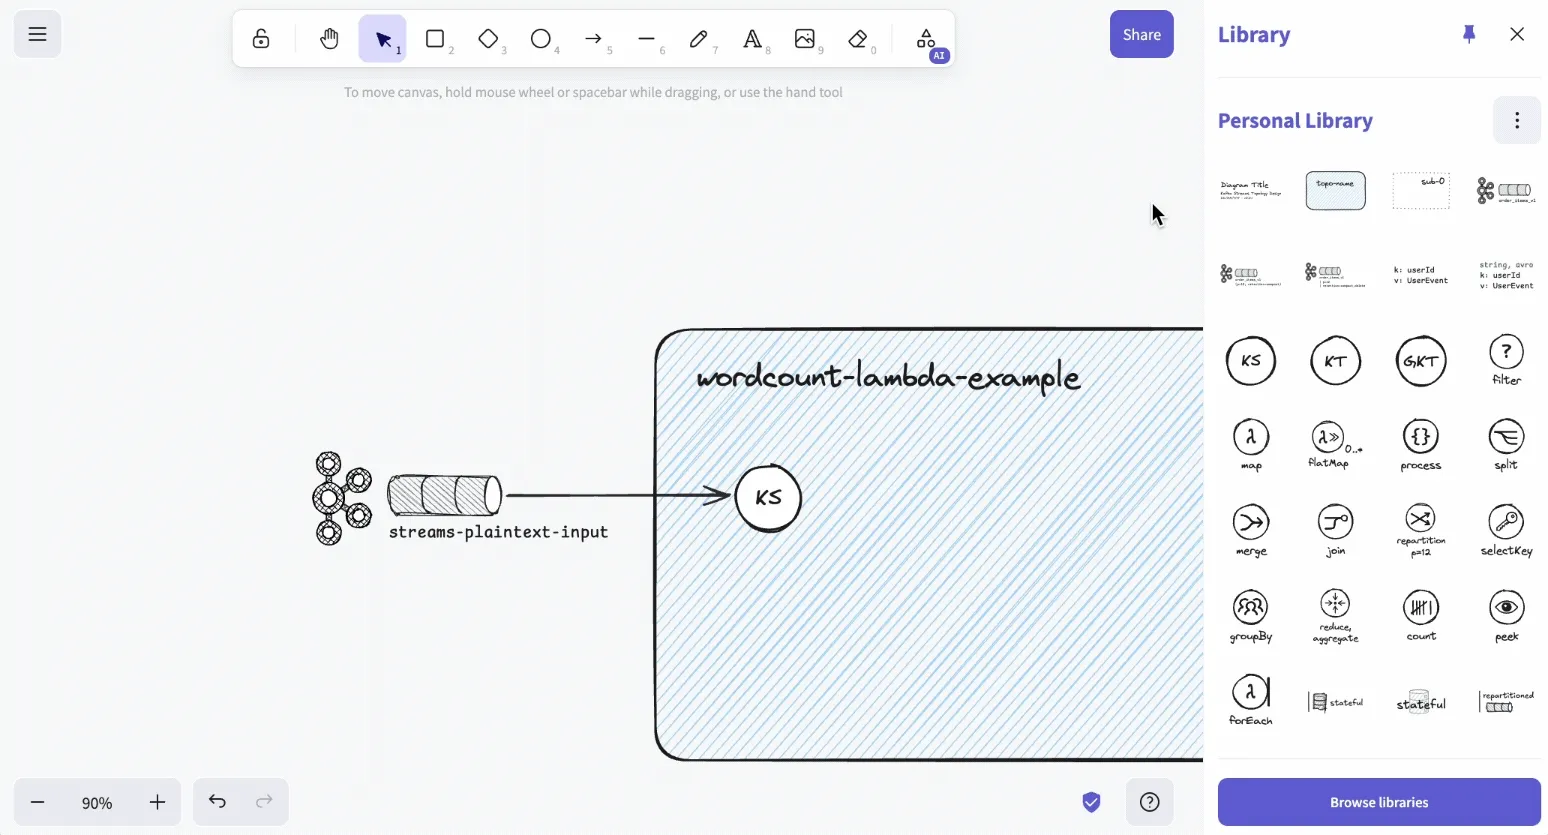
First things first, we add a topology. Simply drag and drop a new container from the library to the canvas. Then we give the topology a name: “wordcount-lambda-example”.
Next, we add and name out souce topic “streams-plaintext-input”.
Finally, we add the first DSL component KStream (KS) and connect it to the source topic using a black colored, solid arrow.
Step 2: Diagram Title, Date, Version
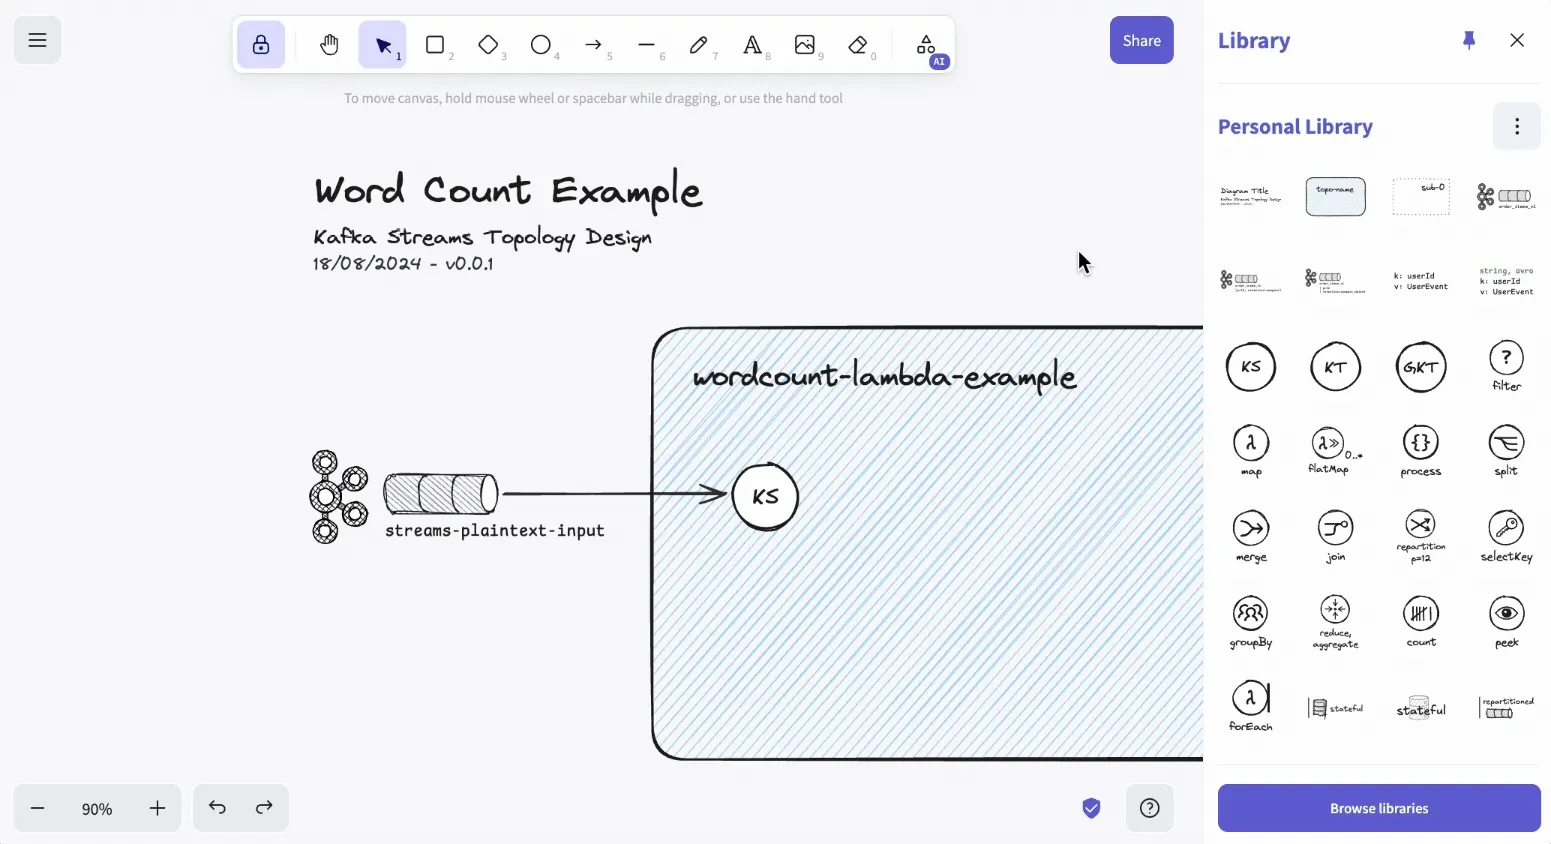
Following the Architecture Diagramming best practices, we now add the most basic diagram metadata: title, date, and version.
To make this as fluent as possible, there’s a header library component provided.
Step 3: Processing Steps, Output Topic
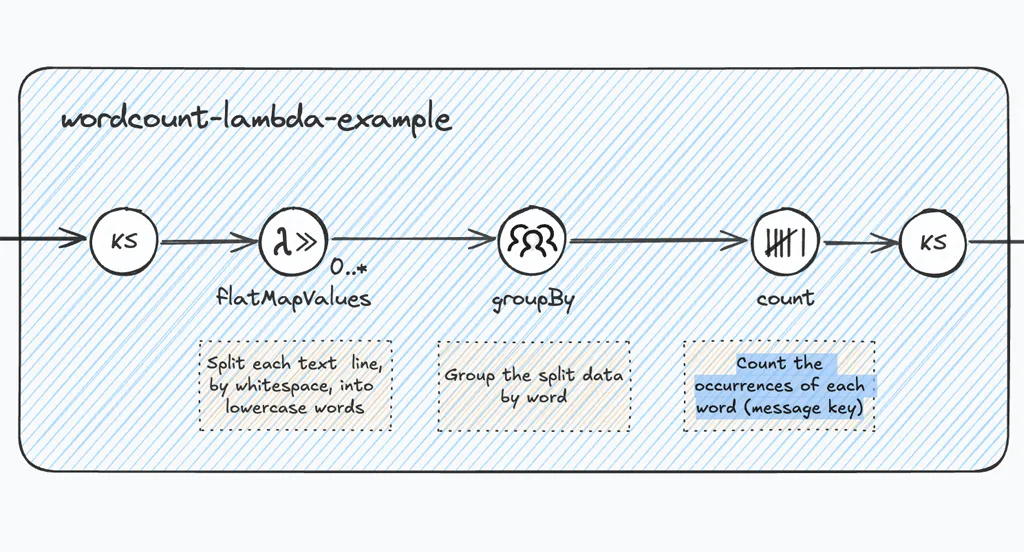
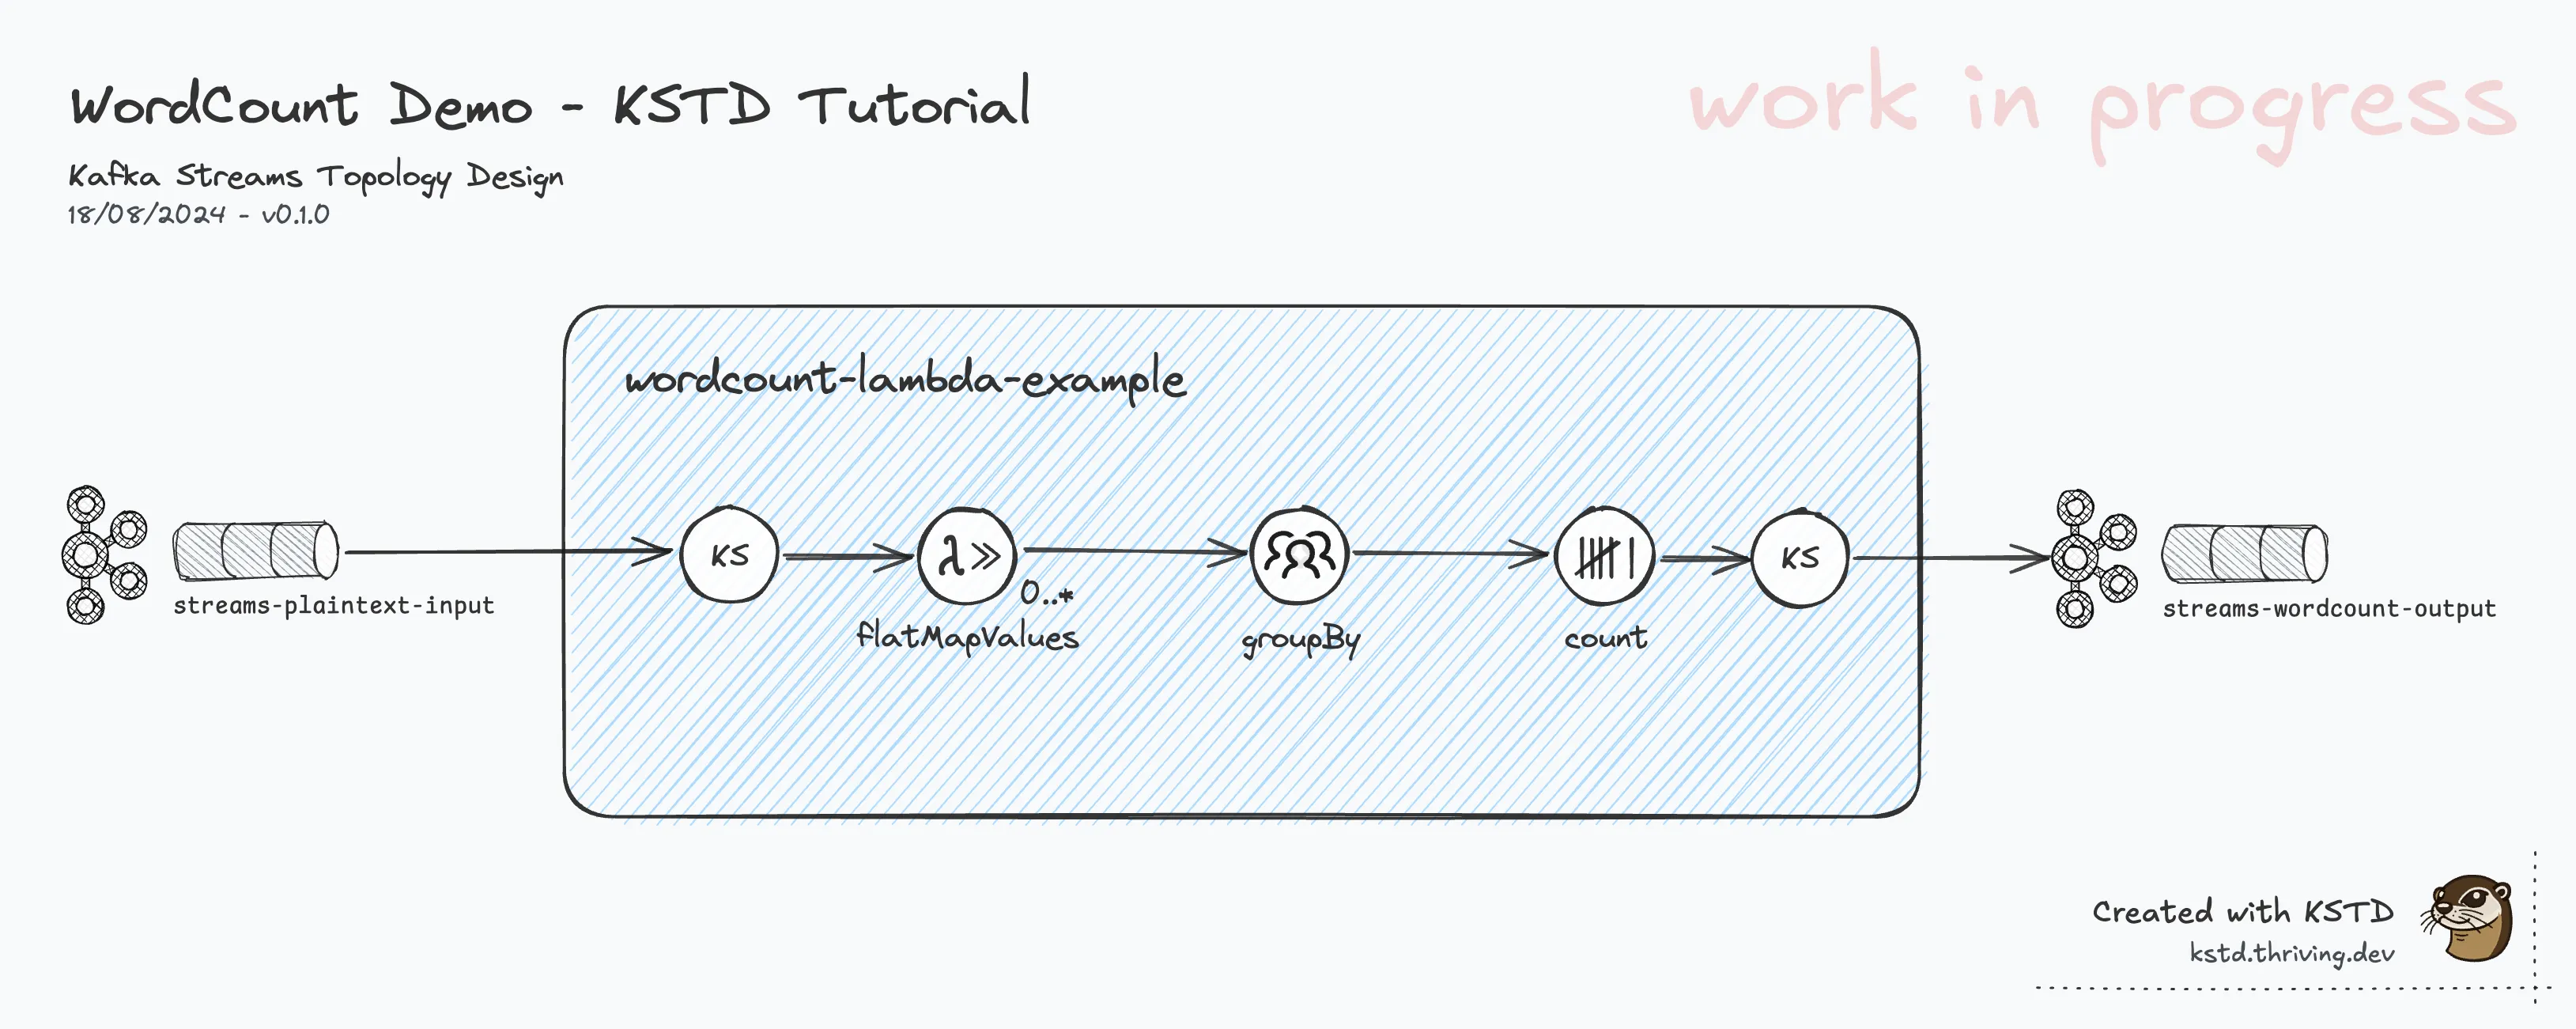
In this step, we complete the stream processing flow by adding and connecting the respective Kafka Streams DSL components, strictly following the #topology-recap:
- flatMapValues
- groupBy
- count
- KStream
Last but not least, we add, name, and connect the output topic.
Step 4: Details, Details, Details!
OK, now we have a diagram showing all processing steps of the ‘wordcount-lambda-example’ topology, including its source topic and sink topic.
We give the diagram version the first minor bump to 0.1.0.
This is how it looks at this stage:
Rhetorical questions:
- Is this version a good and useful diagram?
- Just by looking at the diagram, would you be able to
- …tell how the data streams (in/out) look like? (data types/Serdes, content)
- …understand or implement the details of the transformation in the
flatMapValuestep?
The simple answer: No!! We’d be guessing, making assumptions that might not actually be correct. This is not what we’re aiming for. It effectively makes the diagram useless, if not misleading!
To address this lack of detail, we’ll add the data types and some basic content descriptor for the source and sink
topic, and also inline description of the processing steps flatMapValues, and groupBy - the only steps that have
actual business logic (Java code, passed as lambda functions).
PS: Make use of the KSTD library components available.
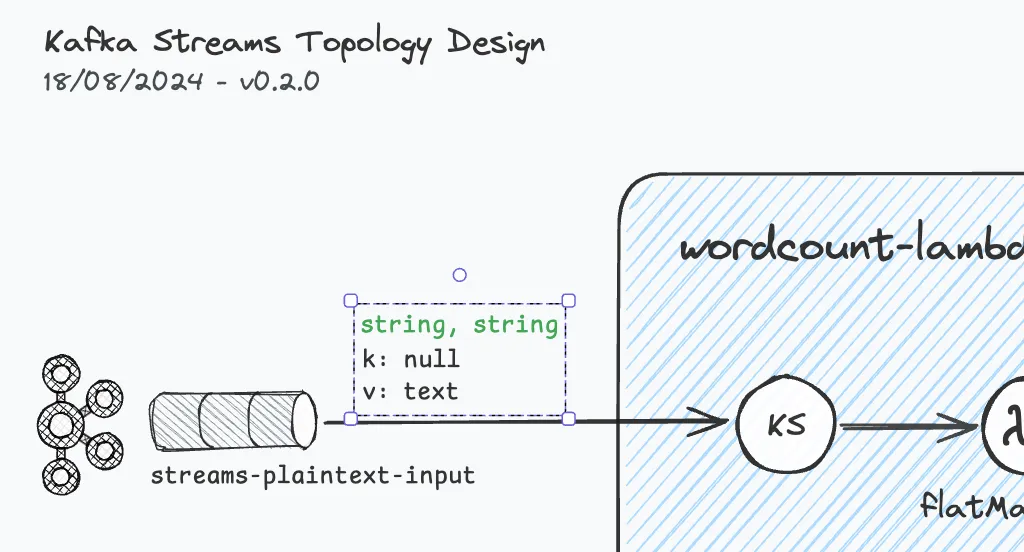
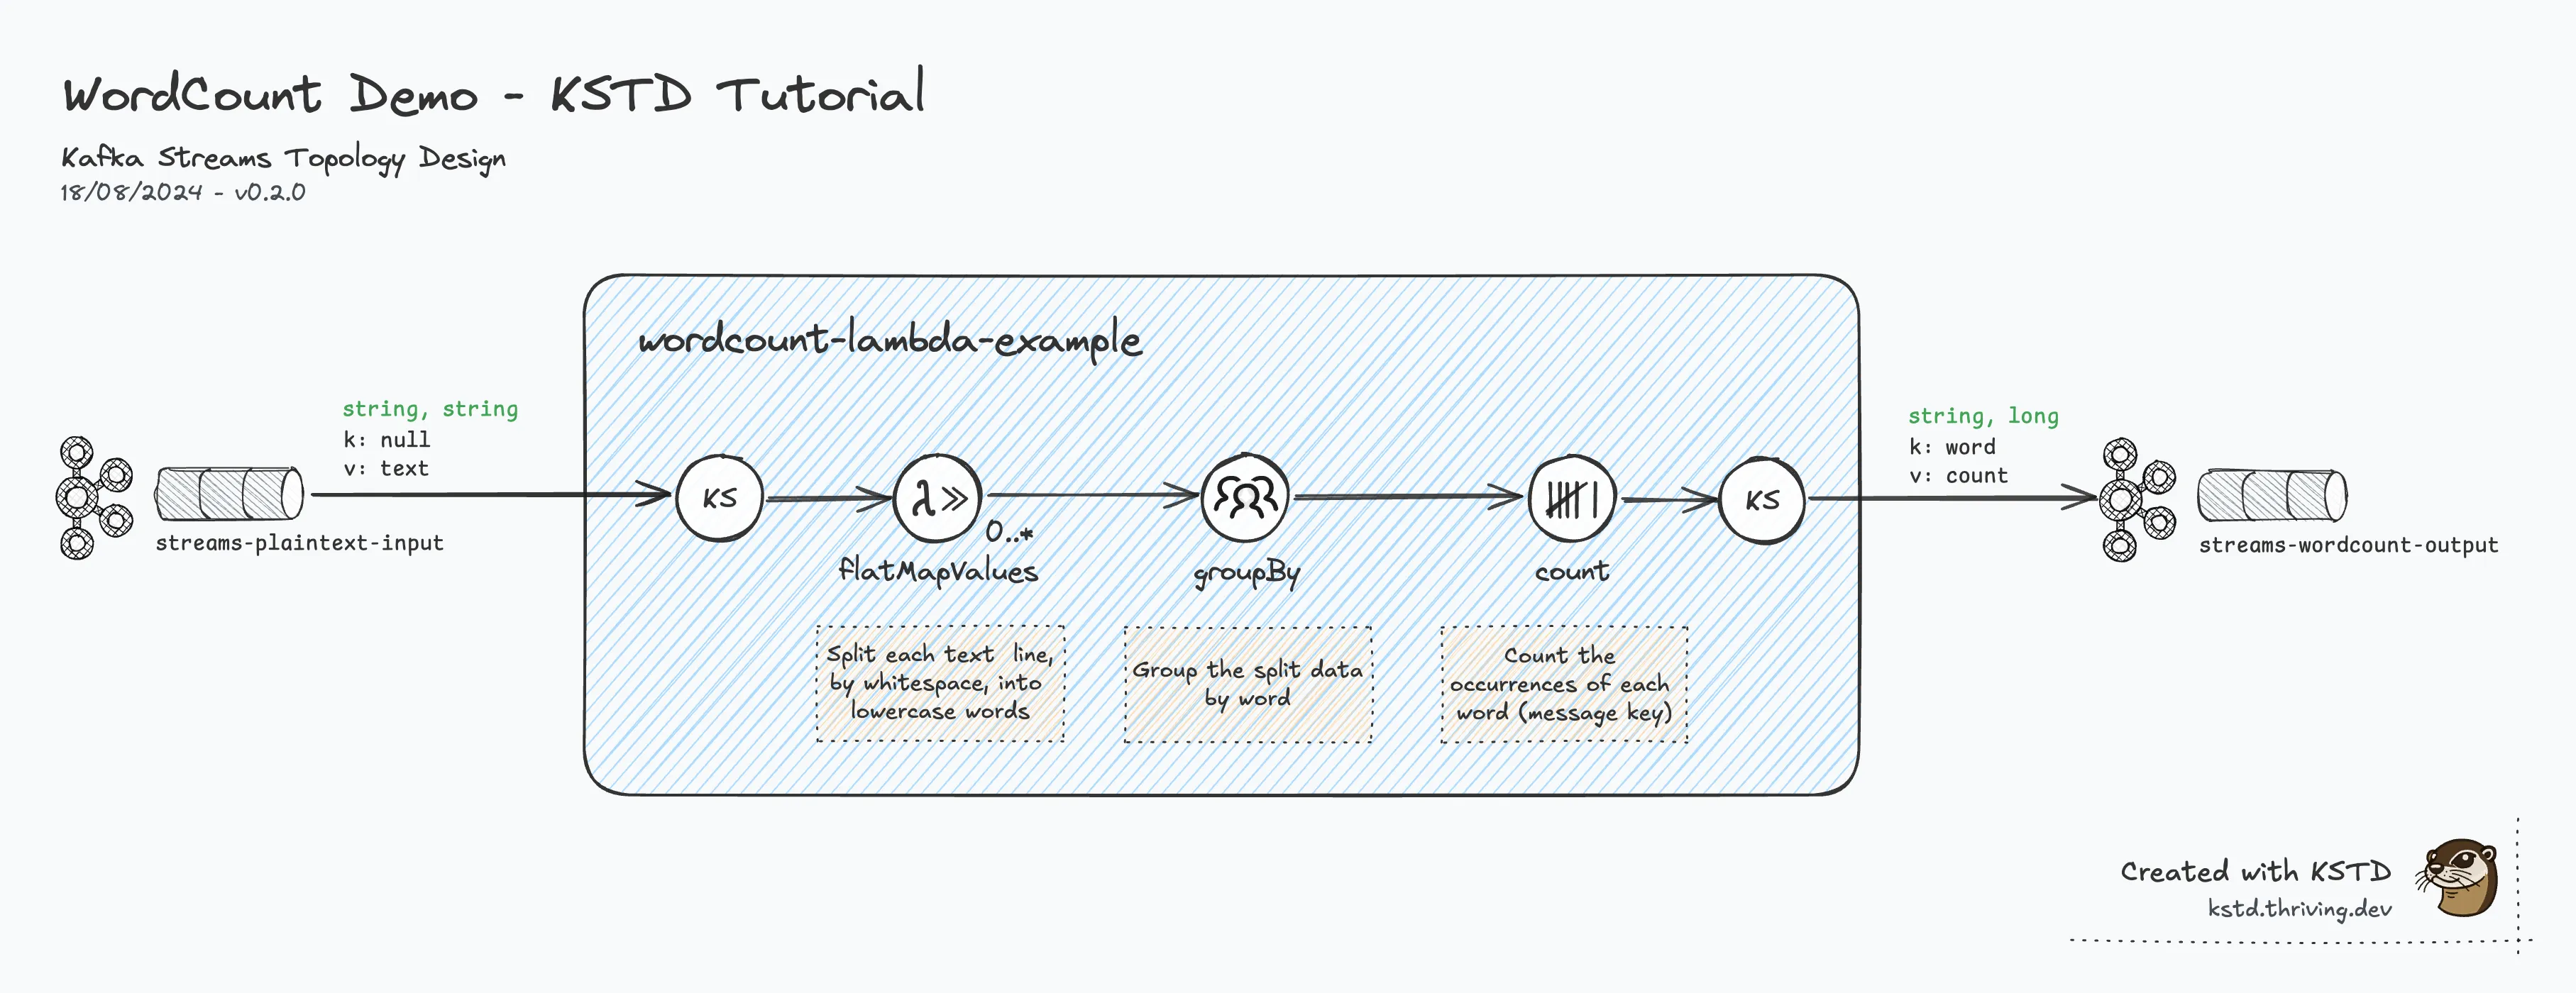
The input topic "streams-plaintext-input" has records with typically null keys, and values with arbitrary ‘text’.
According to the implementation, a stringSerde is used for both key and value.
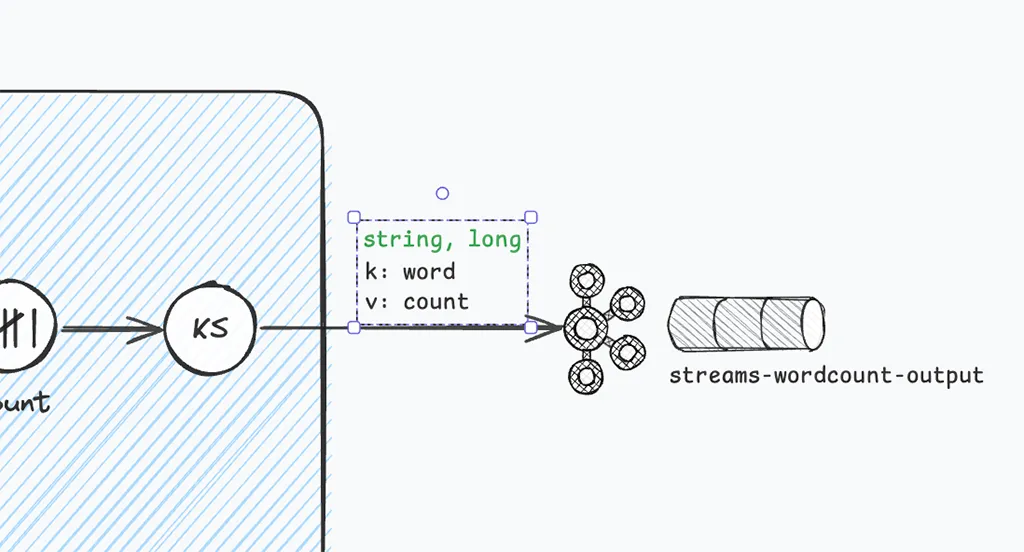
Data published to the output topic, the result of the groupBy + count processing steps,
have a string key (the word), and a long value (the number of the word’s occurrences).
Last, but not least, we add concise descriptions for the processing steps. This will help the viewer to understand what’s happening throughout the stream processing pipeline, without the need to verbally describe this (communication overhead), or having to look at the source code.
Final Result
Here’s a final version of the Kafka Streams topology diagram as version 0.2.0:
This wraps up this simple tutorial.
Conclusions, Next Steps
Having created your first diagram hands-on should give an initial idea on how to lay out and structure a KSTD diagram.
Move on to the next section to learn all about the standard.
(Bonus: Drawing The Full Picture)
In this bonus step, we’re adding the following details to our design:
- Named Processing Steps: (above each step) all Processor nodes are named.
(Why is this important? -> KSTD Standard) - Internal concepts such as repartition topics and state stores, using advanced notation indicators
- Sub-topologies (dotted line blue boxes) show how Kafka Streams splits up topologies under the hood due to stream repartitioning.

